
Project Overview
Project Overview
Project Overview
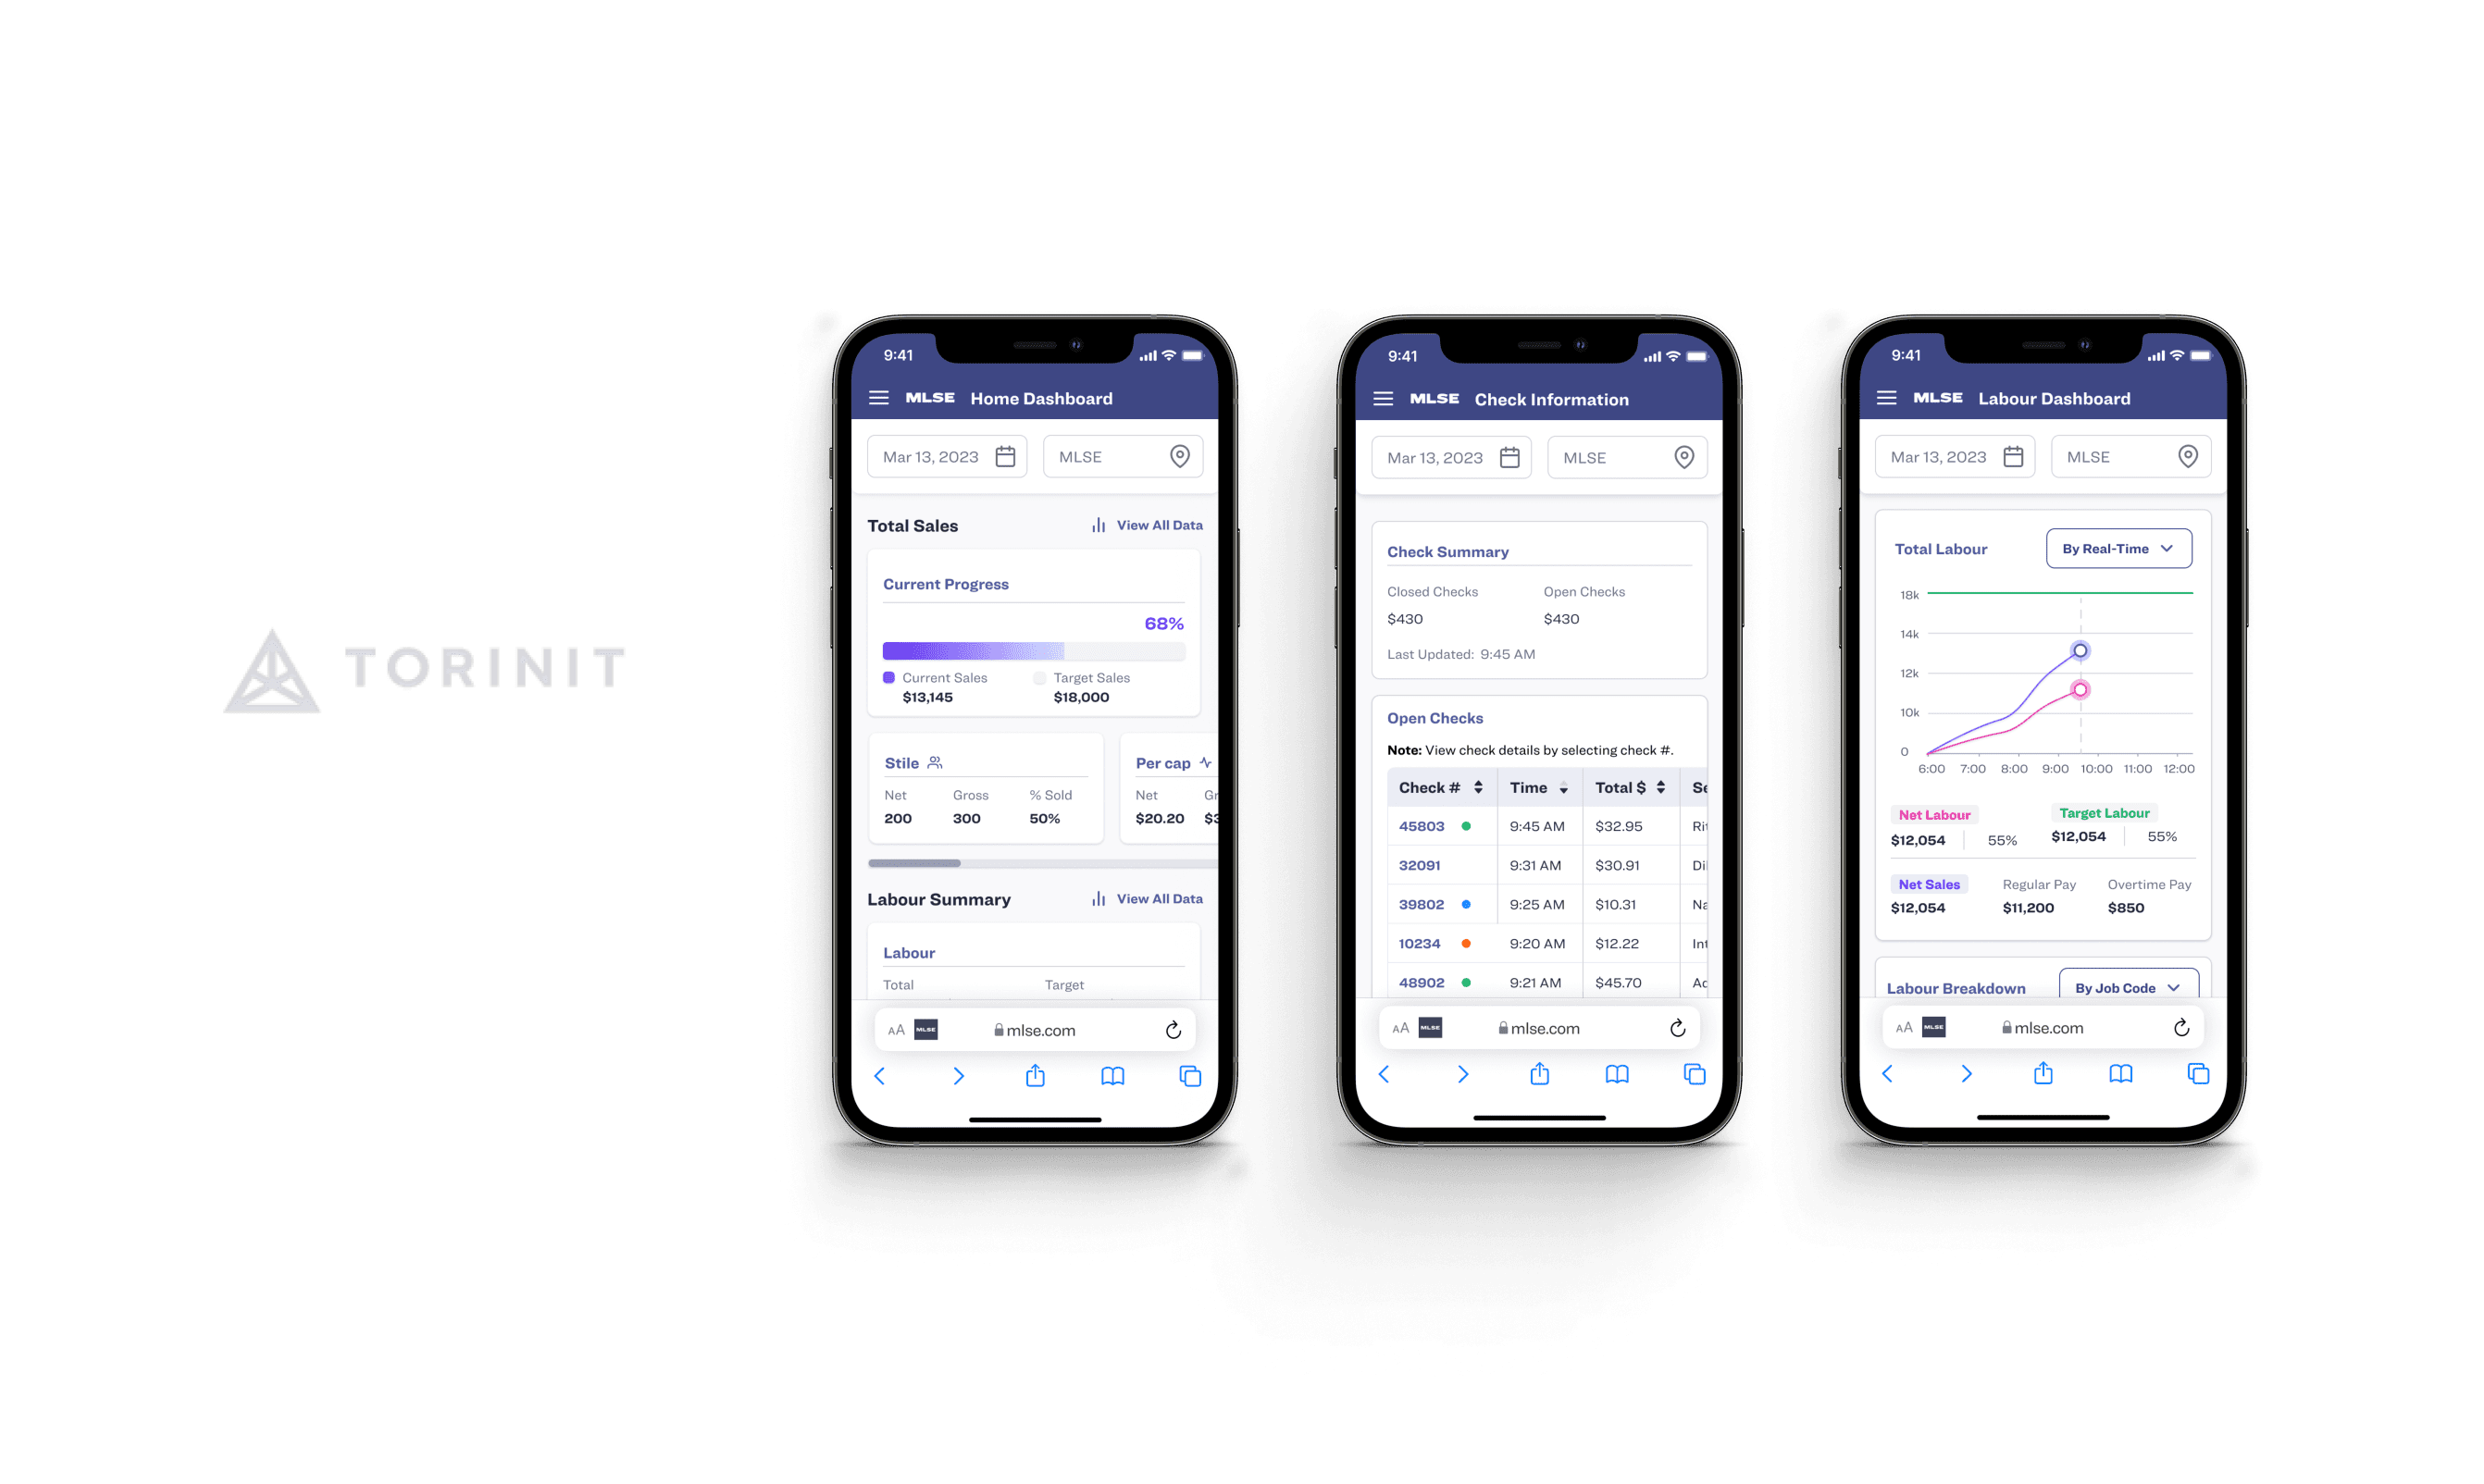
Through my agency, we worked with the Maple Leafs Sports and Entertainment Centre (MLSE) to address their issues with managing large scale events. Currently, managers are only able to see their sales performance after the event finishes, which affects their ability to make decisions about staffing and inventory.
The purpose of this project was to design a real-time revenue dashboard for managers to get information about sales, cost of goods, and other information to help inform their decisions while on the job.
How did I add value?
How did I add value?
How did I add value?
I was designer #3 at Torinit and their first ever intern! I was able to not only shape their design internship program, but was the lead designer working on building a framework for dashboard design that we shipped in April 2023.
I was designer #3 at Torinit and their first ever intern! I was able to not only shape their design internship program, but was the lead designer working on building a framework for dashboard design that we shipped in April 2023.
Timeline
Timeline
Timeline
December 2022 - July 2023
December 2022 - July 2023
Team
Team
Team
2 product managers
1 engagement manager
12 developers
2 product designers
2 product managers
1 engagement manager
12 developers
2 product designers
Skills
Skills
Skills
User Research
A/B Testing
Rapid Prototyping
User Research
A/B Testing
Rapid Prototyping
Thus, I asked…
Thus, I asked…
Thus, I asked…
How might we create an all-inclusive revenue dashboard app for our clients and their team?
How might we create an all-inclusive revenue dashboard app for our clients and their team?
Background
Background
Background
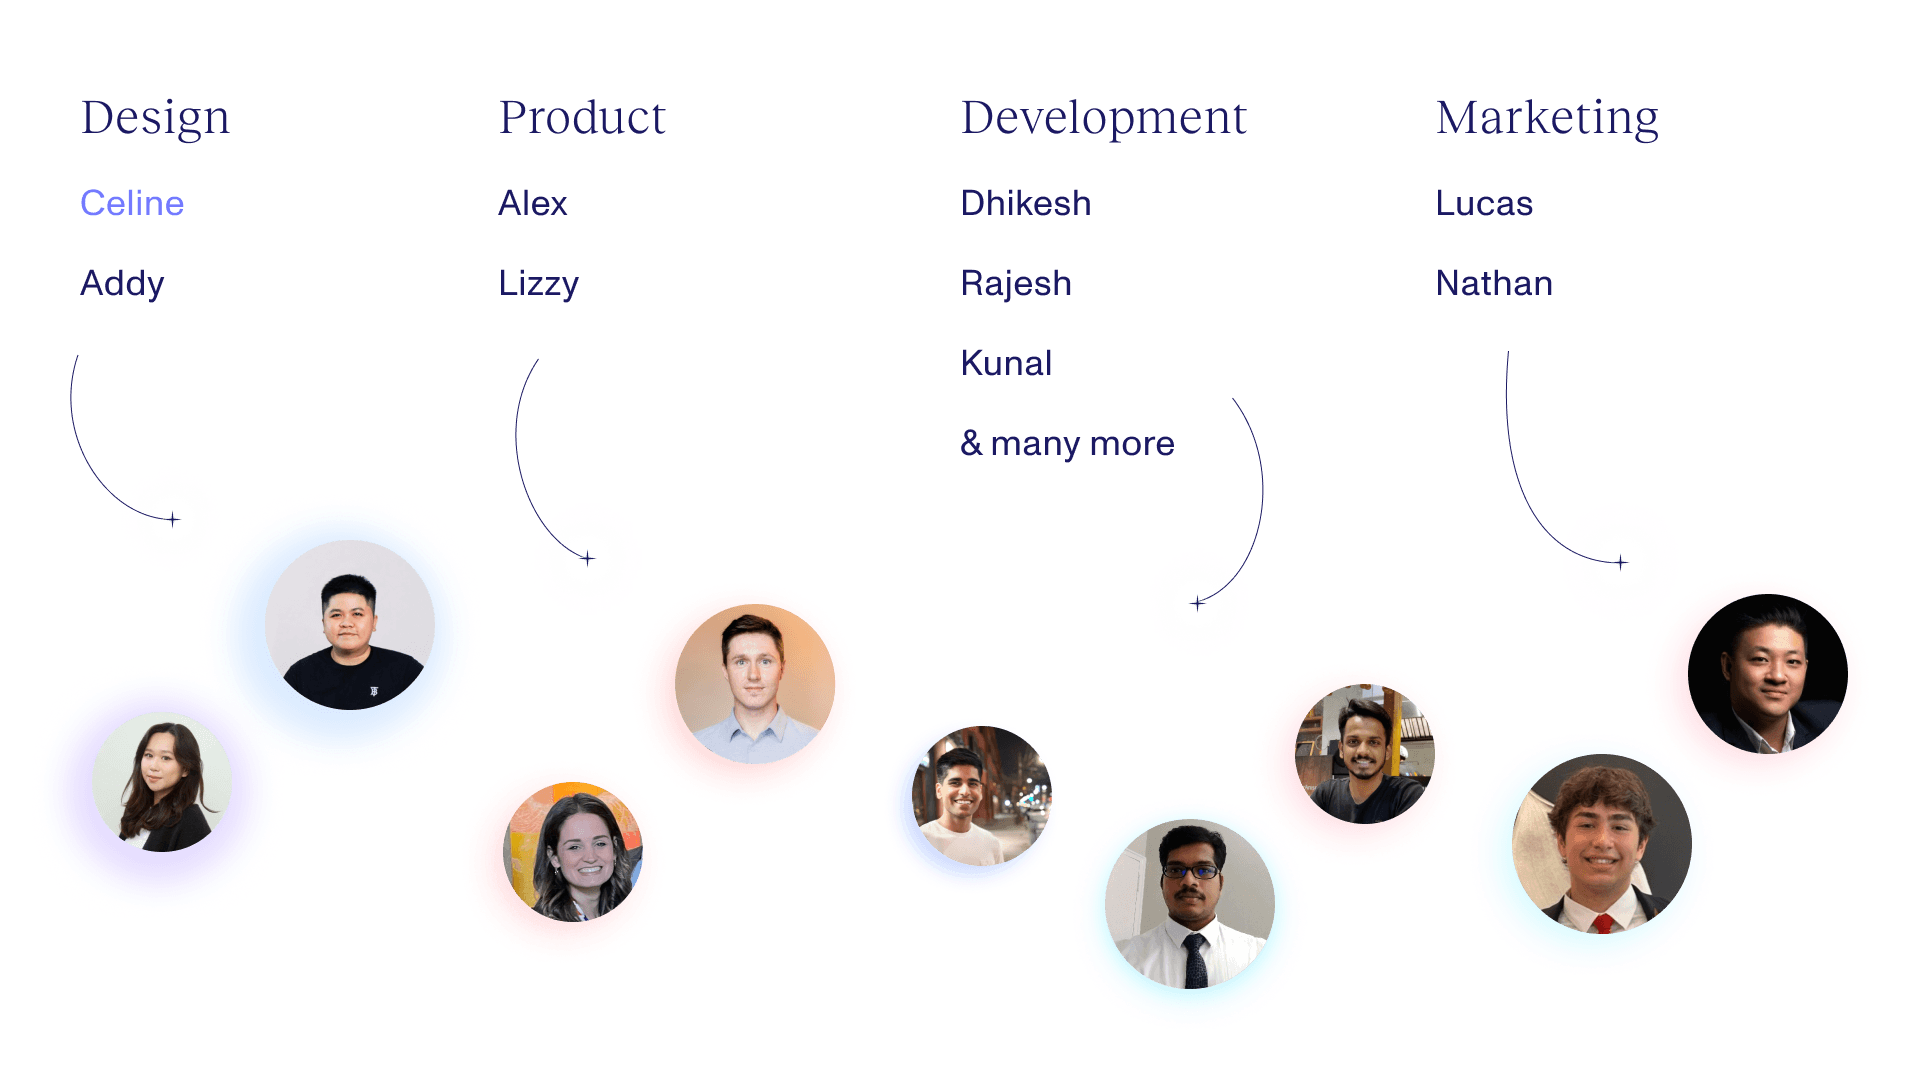
I was the lead designer on this project, leaning on my design mentor (shoutout to Addy!) and other designers on the team for feedback. I took charge of the user research, usability testing, design system, and presented to clients. My product manager, Alex, was a huge asset to understanding user specifications and more about the entertainment industry.
I was the lead designer on this project, leaning on my design mentor (shoutout to Addy!) and other designers on the team for feedback.
I took charge of the user research, usability testing, design system, and presented to clients. My product manager, Alex, was a huge asset to understanding user specifications and more about the entertainment industry.


Who were our clients?
Who were our clients?
Who were our clients?
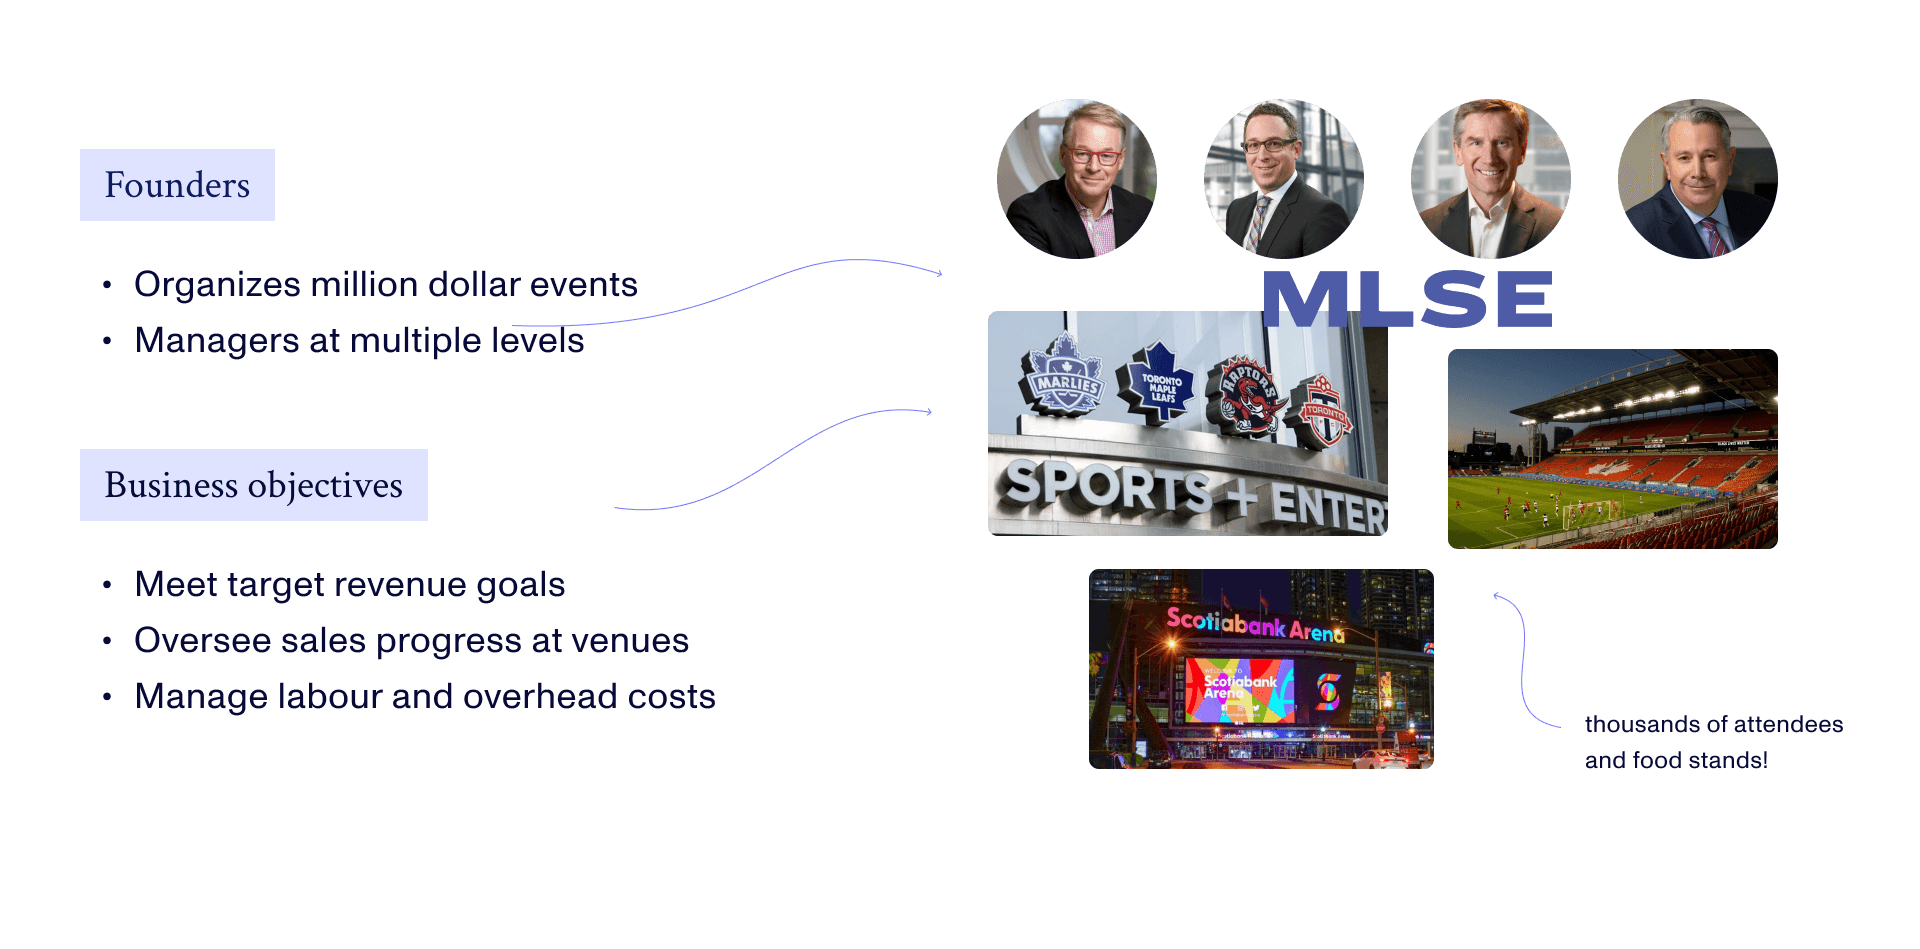
Our client was the Maple Leaf Sports and Entertainment (MLSE) and their management team. They're responsible for overseeing the success of these events, ranging from concerts, sports tournaments, and all the sales associated with running them successfully.


What was the main problem?
What was the main problem?
What was the main problem?
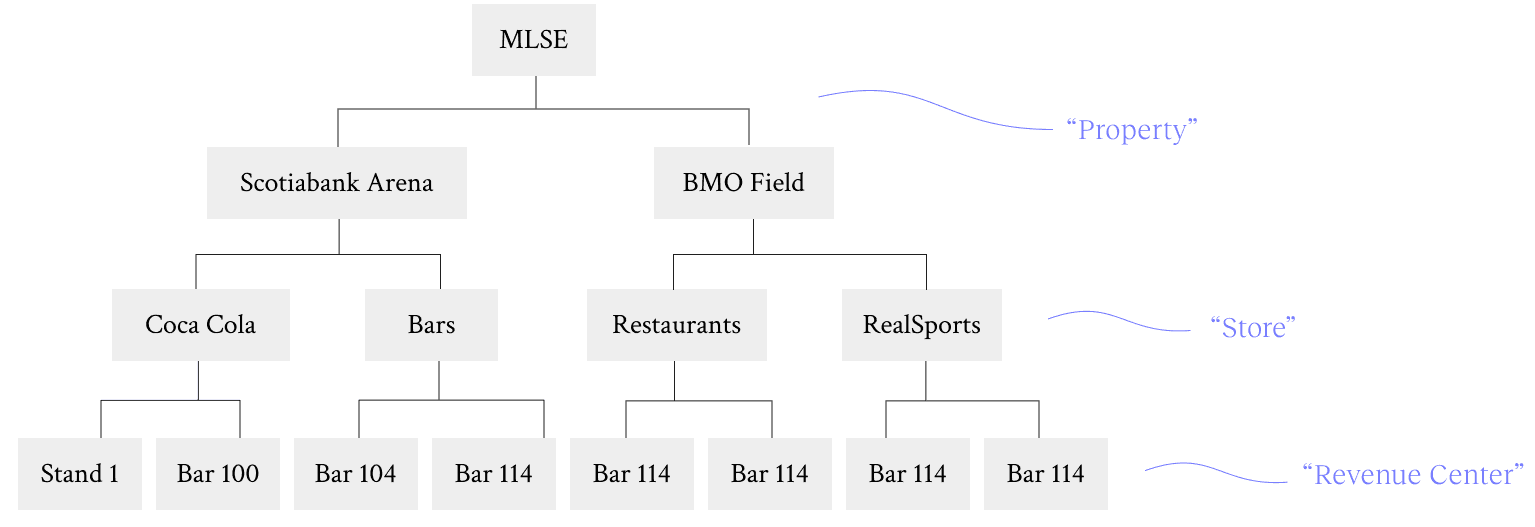
MLSE oversees multiple 'properties' where they host large-scale events. In these properties, there are individual 'stores' and 'revenue centers' that sell things such as food. As a result, there are managers at every level who are responsible for the revenue, inventory, and labour of their specific area.
MLSE oversees multiple 'properties' where they host large-scale events. In these properties, there are individual 'stores' and 'revenue centers' that sell things such as food. As a result, there are managers at every level who are responsible for the revenue, inventory, and labour of their specific area.


Problem statement:
Problem statement:
How might we create an all-inclusive dashboard that caters to managers at every different level?
How might we create an all-inclusive dashboard that caters to managers at every different level?
What were some project constraints?
What were some project constraints?
What were some project constraints?
Working at an agency means working in small but mighty teams.
Working at an agency means working in small but mighty teams.
Ensuring completion within a short period
Ensuring completion within a short period
Since our clients wanted an immediate solution, they gave us a two week completion deadline.
Since our clients wanted an immediate solution, they gave us a two week completion deadline.
Prioritizing the web app experience for users
Prioritizing the web app experience for users
For simplicity, our clients wanted a web app that could be accessed on any type of device.
For simplicity, our clients wanted a web app that could be accessed on any type of device.
Limitations in available data and API licensing
Limitations in available data and API licensing
There was a limited budget for integrating advanced analytics and available historical data.
There was a limited budget for integrating advanced analytics and available historical data.
How did we learn about our clients needs?
How did we learn about our clients needs?
How did we learn about our clients needs?
Unlike any product we've worked on before, there was a huge diversity in the types of users we were creating this product for. I spent a long time interviewing each level of management and categorizing the different types to understand their needs.
Unlike any product we've worked on before, there was a huge diversity in the types of users we were creating this product for. I spent a long time interviewing each level of management and categorizing the different types to understand their needs.
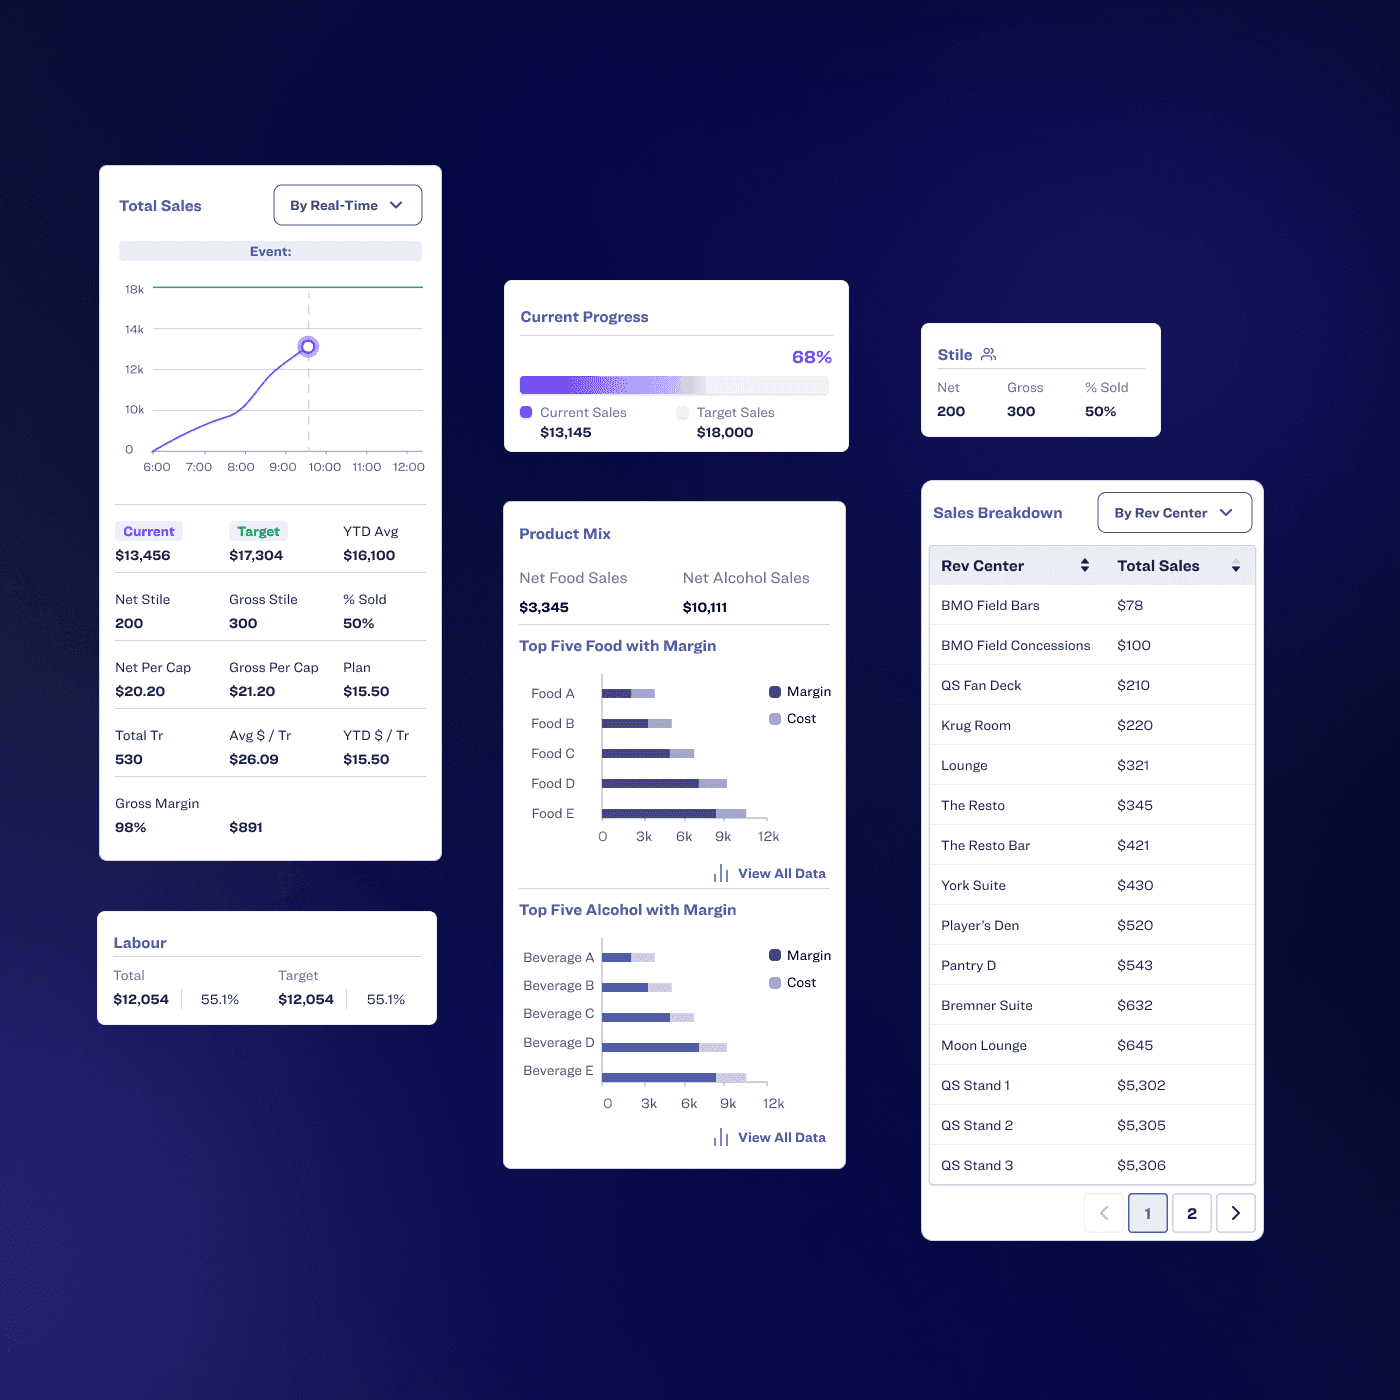


Manager type affected metric preference
Manager type affected metric preference
Manager type affected metric preference
Lower level managers wanted detailed insights while CEOs wanted more general forecasts.
Lower level managers wanted detailed insights while CEOs wanted more general forecasts.
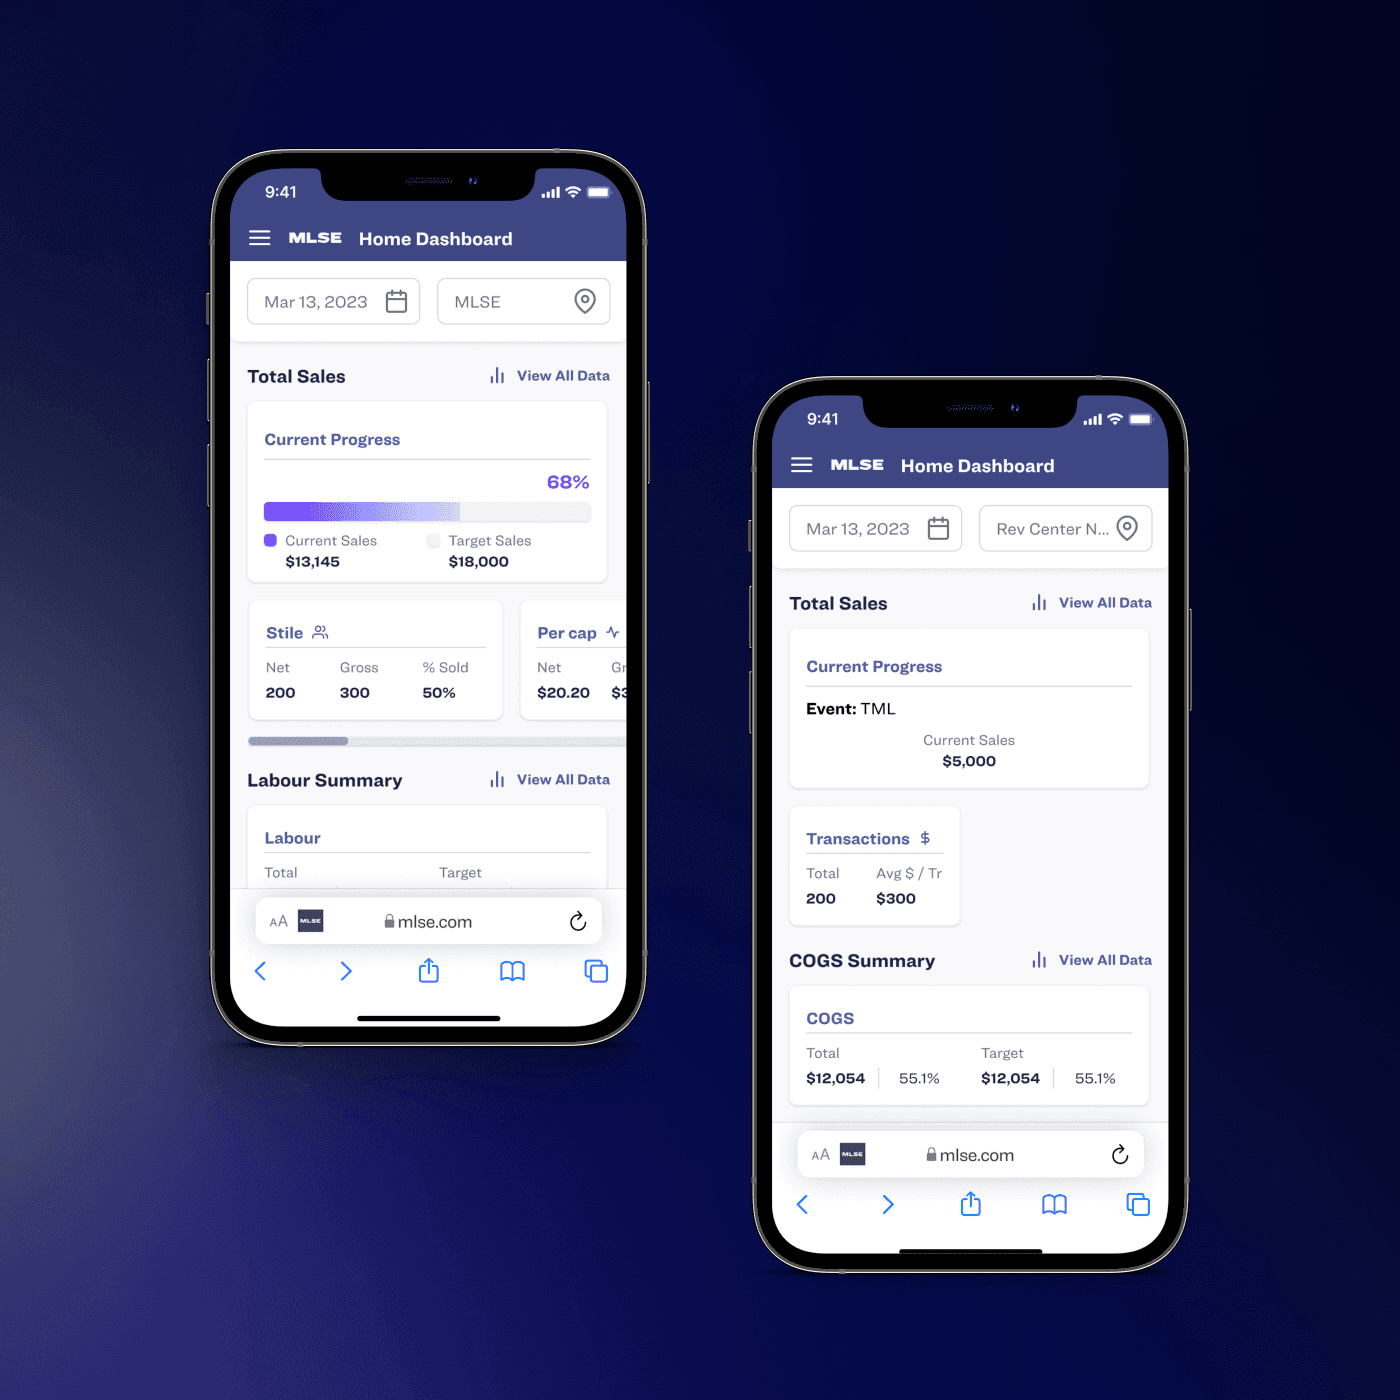


Simple data insights were preferred
Simple data insights were preferred
Simple data insights were preferred
Instead of focusing efforts on fancy data visuals, users data tables that were intuitive to use.
Instead of focusing efforts on fancy data visuals, users data tables that were intuitive to use.
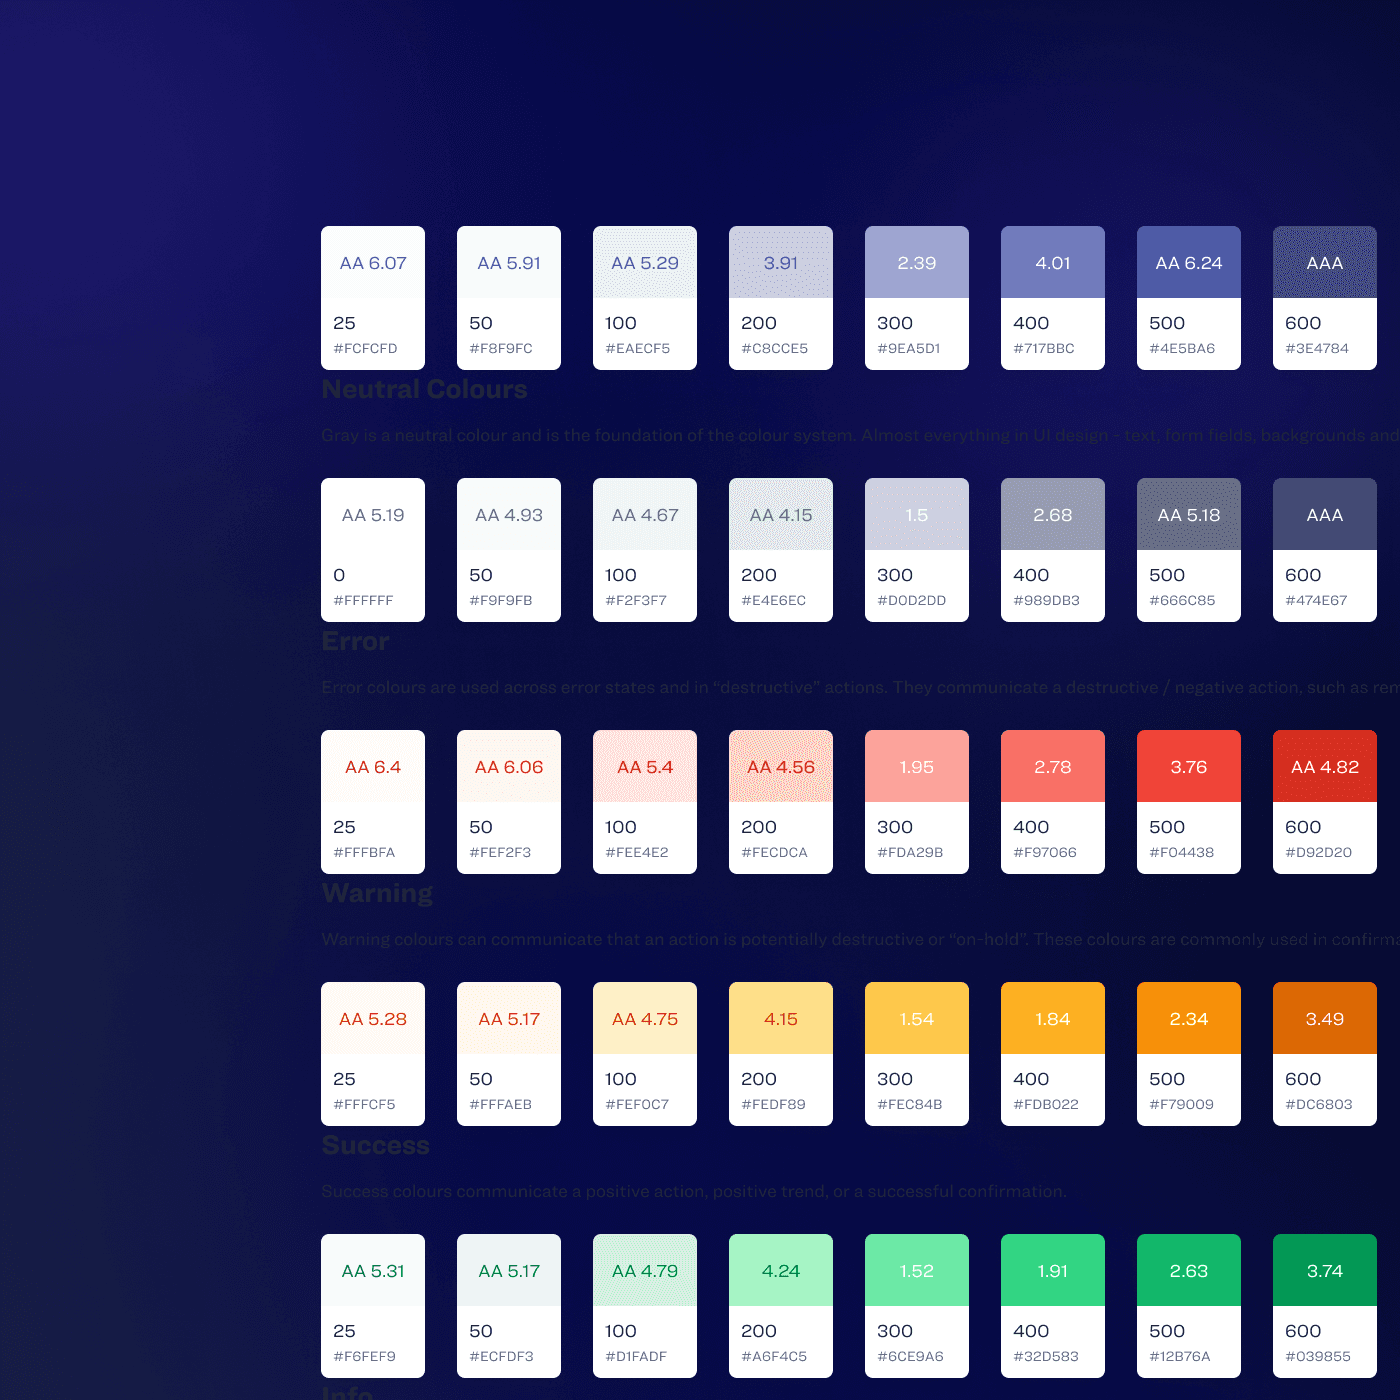


Monochromatic visuals were needed
Monochromatic visuals were needed
Monochromatic visuals were needed
Most users were colourblind, meaning monochromatic colours were preferred.
Most users were colourblind, meaning monochromatic colours were preferred.
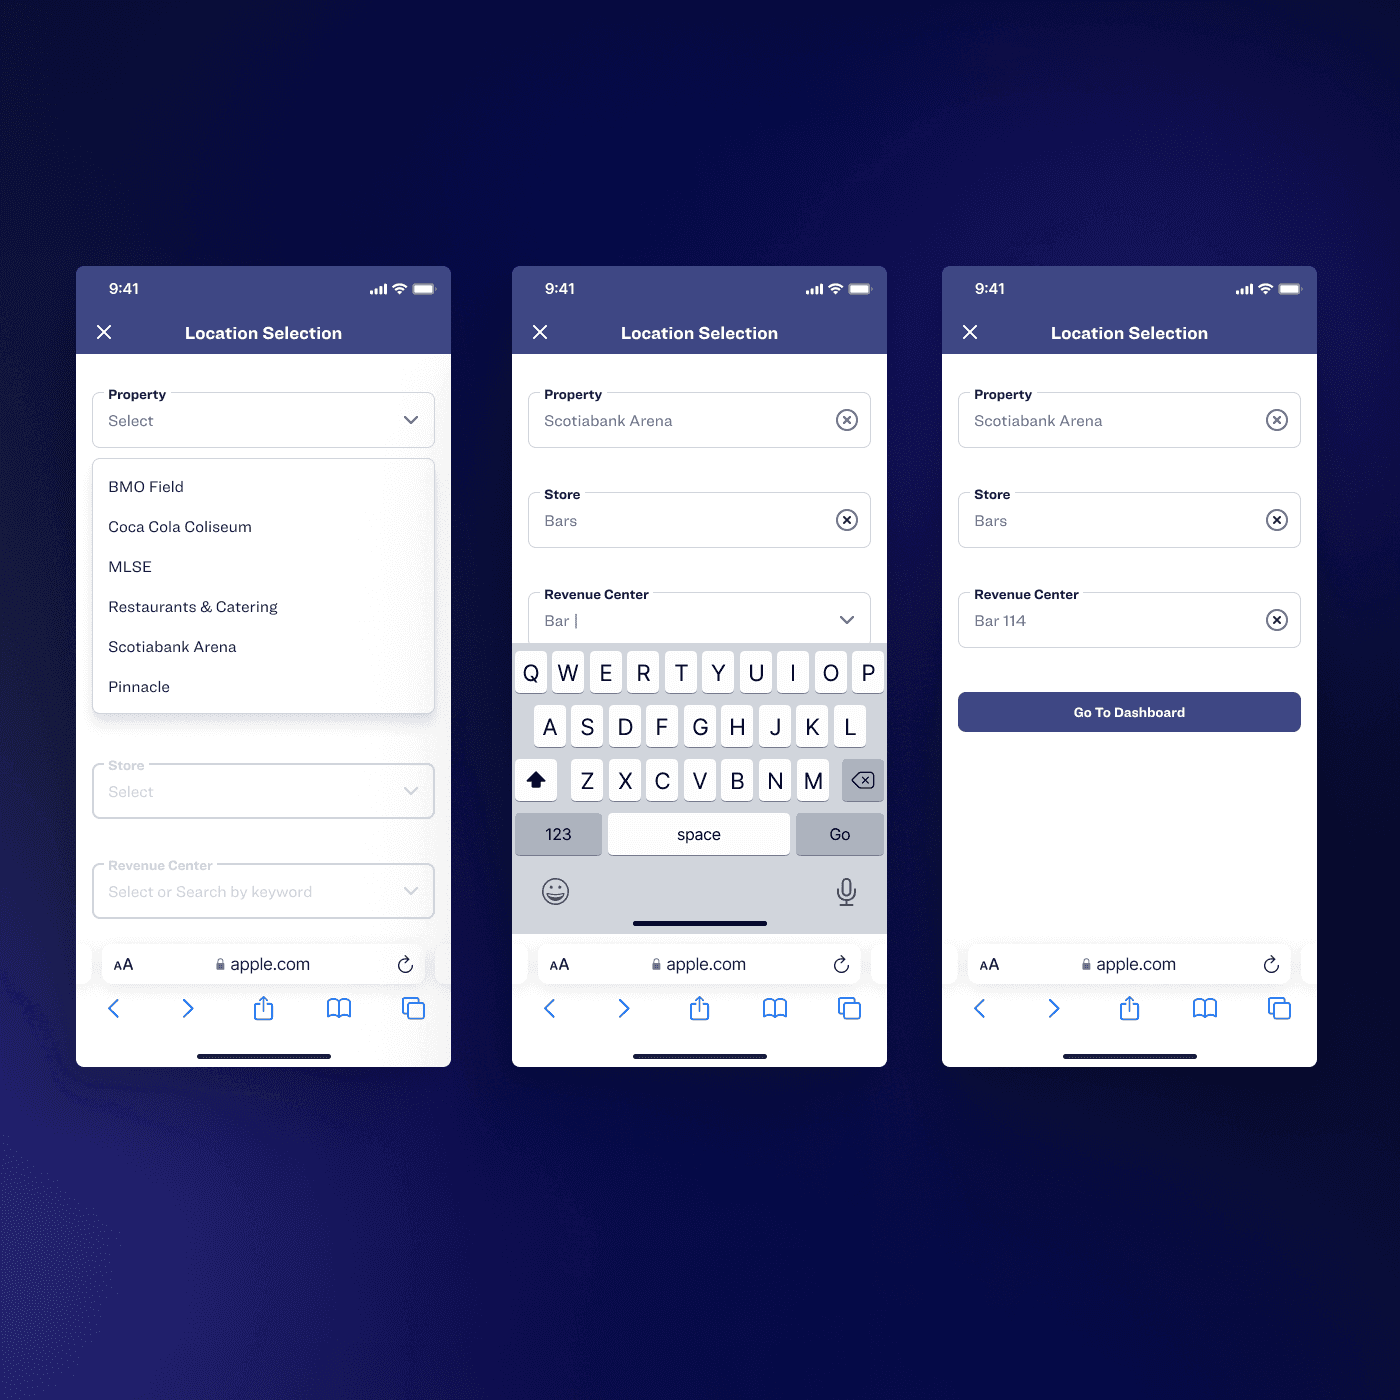


Location selection was essential
Location selection was essential
Location selection was essential
Managers were responsible for multiple venues and want to access progress for all of them.
Managers were responsible for multiple venues and want to access progress for all of them.
How are we currently solving this problem?
How are we currently solving this problem?
How are we currently solving this problem?
Unlike any product we've worked on before, there was a huge diversity in the types of users we were creating this product for. I spent a long time interviewing each level of management and categorizing the different types to understand their needs.
Unlike any product we've worked on before, there was a huge diversity in the types of users we were creating this product for. I spent a long time interviewing each level of management and categorizing the different types to understand their needs.
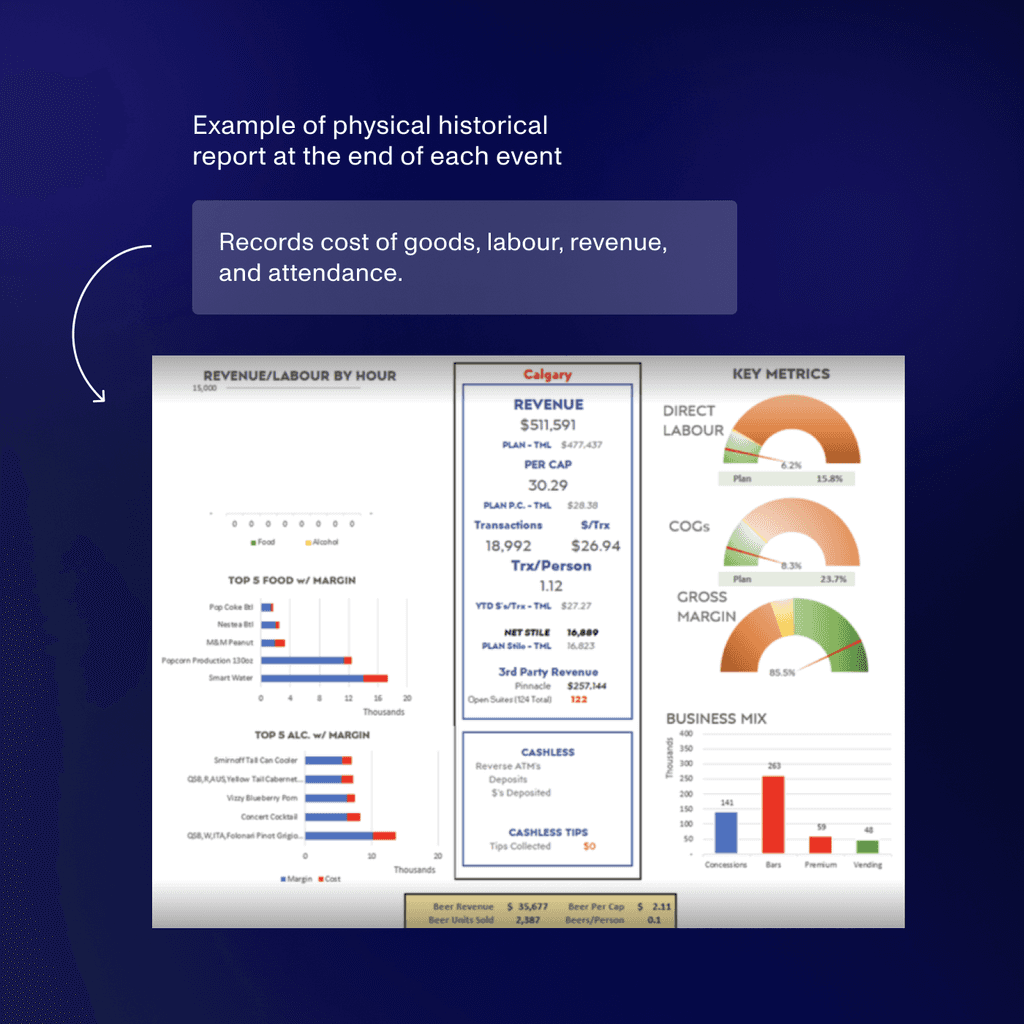


Difficulty estimating event progress between venues
Difficulty estimating event progress between venues
Post-event metrics hinder real-time decision-making
Post-event metrics hinder real-time decision-making
Not all metrics are useful for all user types
Not all metrics are useful for all user types
Useful for long-term financial planning
Useful for long-term financial planning
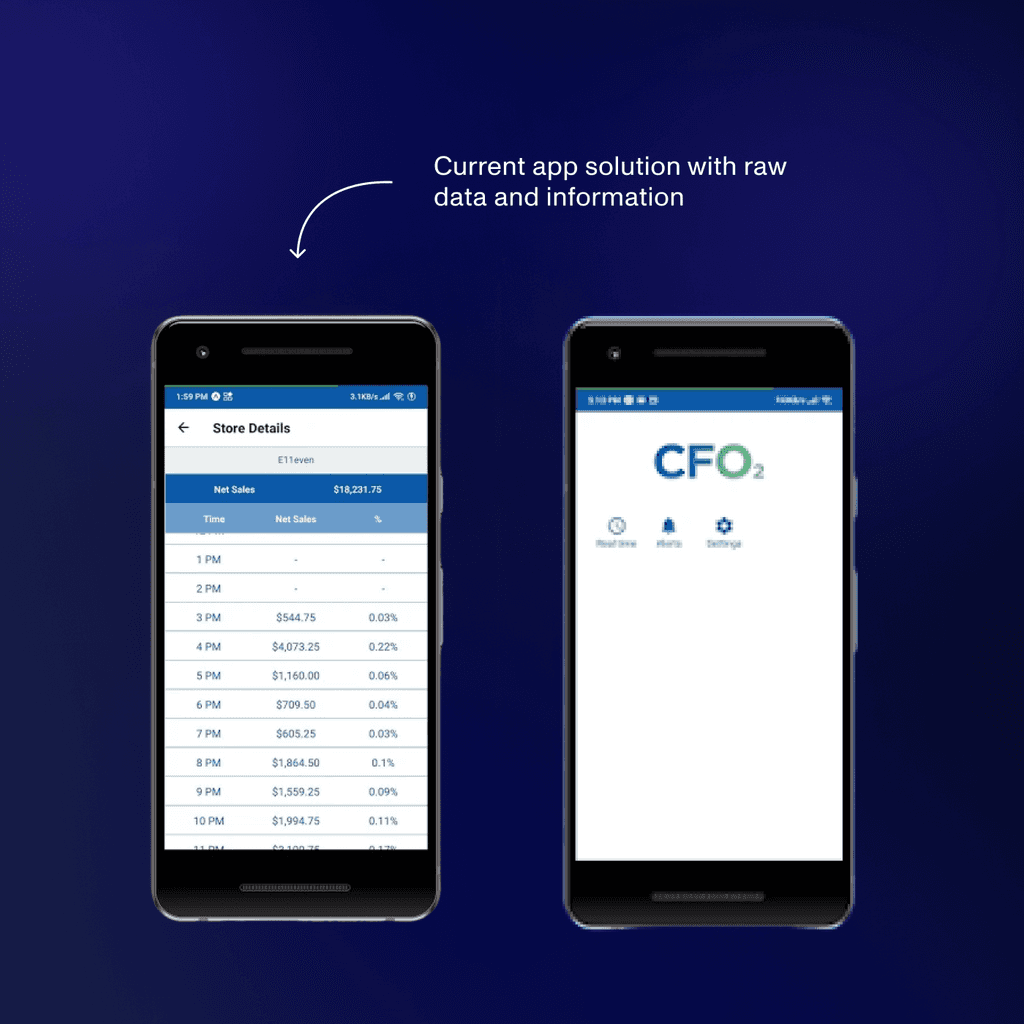


No provide summary insights about progress
No provide summary insights about progress
Difficulty parsing through dense data tables
Difficulty parsing through dense data tables
Missing information about labour
Missing information about labour
Useful for finding information as needed in real-time
Useful for finding information as needed in real-time
How did we compare with other competitors?
How did we compare with other competitors?
How did we compare with other competitors?
I prioritized looking at other dashboard apps that scaled their designs nicely on mobile. I took note of how they simplified data visuals, kept the navigation intuitive, and noted the advantages of each solution.
One of the major questions for the product team was aligning on what design problem to solve. I started by conducting competitive research with other banks that offered check writing options and took a look at how they formatted their product offerings.
Since Baselane is an American bank, I took a look at how other major American and Neobanks offered for payment options.
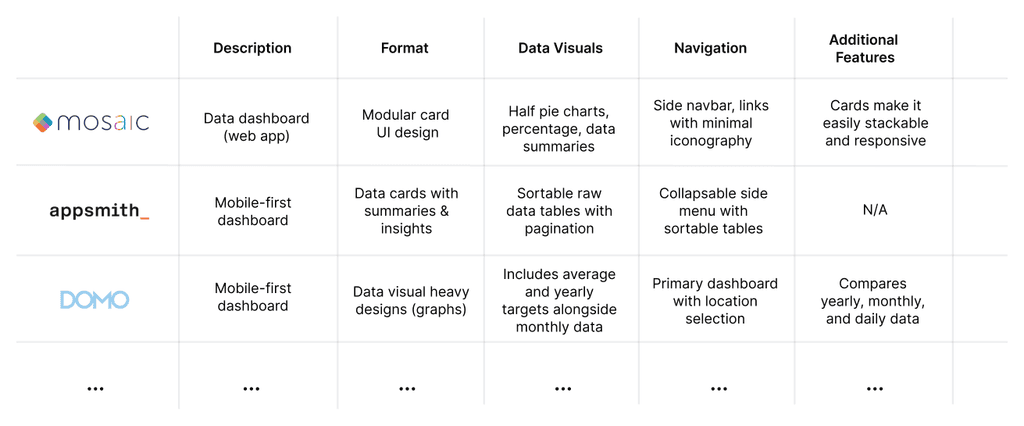


Key takeaways
Key takeaways
Key takeaways
A card-based design with simple data visuals and sortable tables would be mobile-friendly.
Why is this an ideal solution?
Why is this an ideal solution?
Why is this an ideal solution?
Easily scalable / responsive design
Mobile-first for easy access
Mobile-first for easy access
Ability to see raw data tables easily
Ability to see raw data tables easily
What did the brainstorming process look like?
What did the brainstorming process look like?
Consolidating pain points
Consolidating pain points
Consolidating pain points
I defined all the user pain points from the user interviews, competitive analysis, and critique of current solutions they use.
Establishing a new user flow
Establishing a new user flow
Establishing a new user flow
Alongside my PM, I cold designed possible sketches that could reflect the dashboard and new flow for selecting specific locations.
Alongside my PM, I cold designed possible sketches that could reflect the dashboard and new flow for selecting specific locations.
Defining the design system
Defining the design system
Defining the design system
I defined the colour, typography, spacing specifications, and elevation so it was simple and aligned with their brand.
I defined the colour, typography, spacing specifications, and elevation so it was simple and aligned with their brand.
What did users think about the initial designs?
What did users think about the initial designs?
What did users think about the initial designs?
It was essential that I took the first round of iterations and presented them to the client to get feedback. I created structured interview sessions where they could navigate the prototype and provide feedback using a live testing software called Maze.
It was essential that I took the first round of iterations and presented them to the client to get feedback. I created structured interview sessions where they could navigate the prototype and provide feedback using a live testing software called Maze.


Metrics still needed to be refined
Metrics still needed to be refined
Metrics still needed to be refined
Lower level managers wanted detailed insights while CEOs wanted more general forecasts.
Lower level managers wanted detailed insights while CEOs wanted more general forecasts.


Additional metrics were required
Additional metrics were required
Additional metrics were required
Instead of focusing efforts on fancy data visuals, users data tables that were intuitive to use.
Instead of focusing efforts on fancy data visuals, users data tables that were intuitive to use.


More relevant sorting features / filtering
More relevant sorting features / filtering
More relevant sorting features / filtering
Most users were colourblind, meaning monochromatic colours were preferred.
Most users were colourblind, meaning monochromatic colours were preferred.
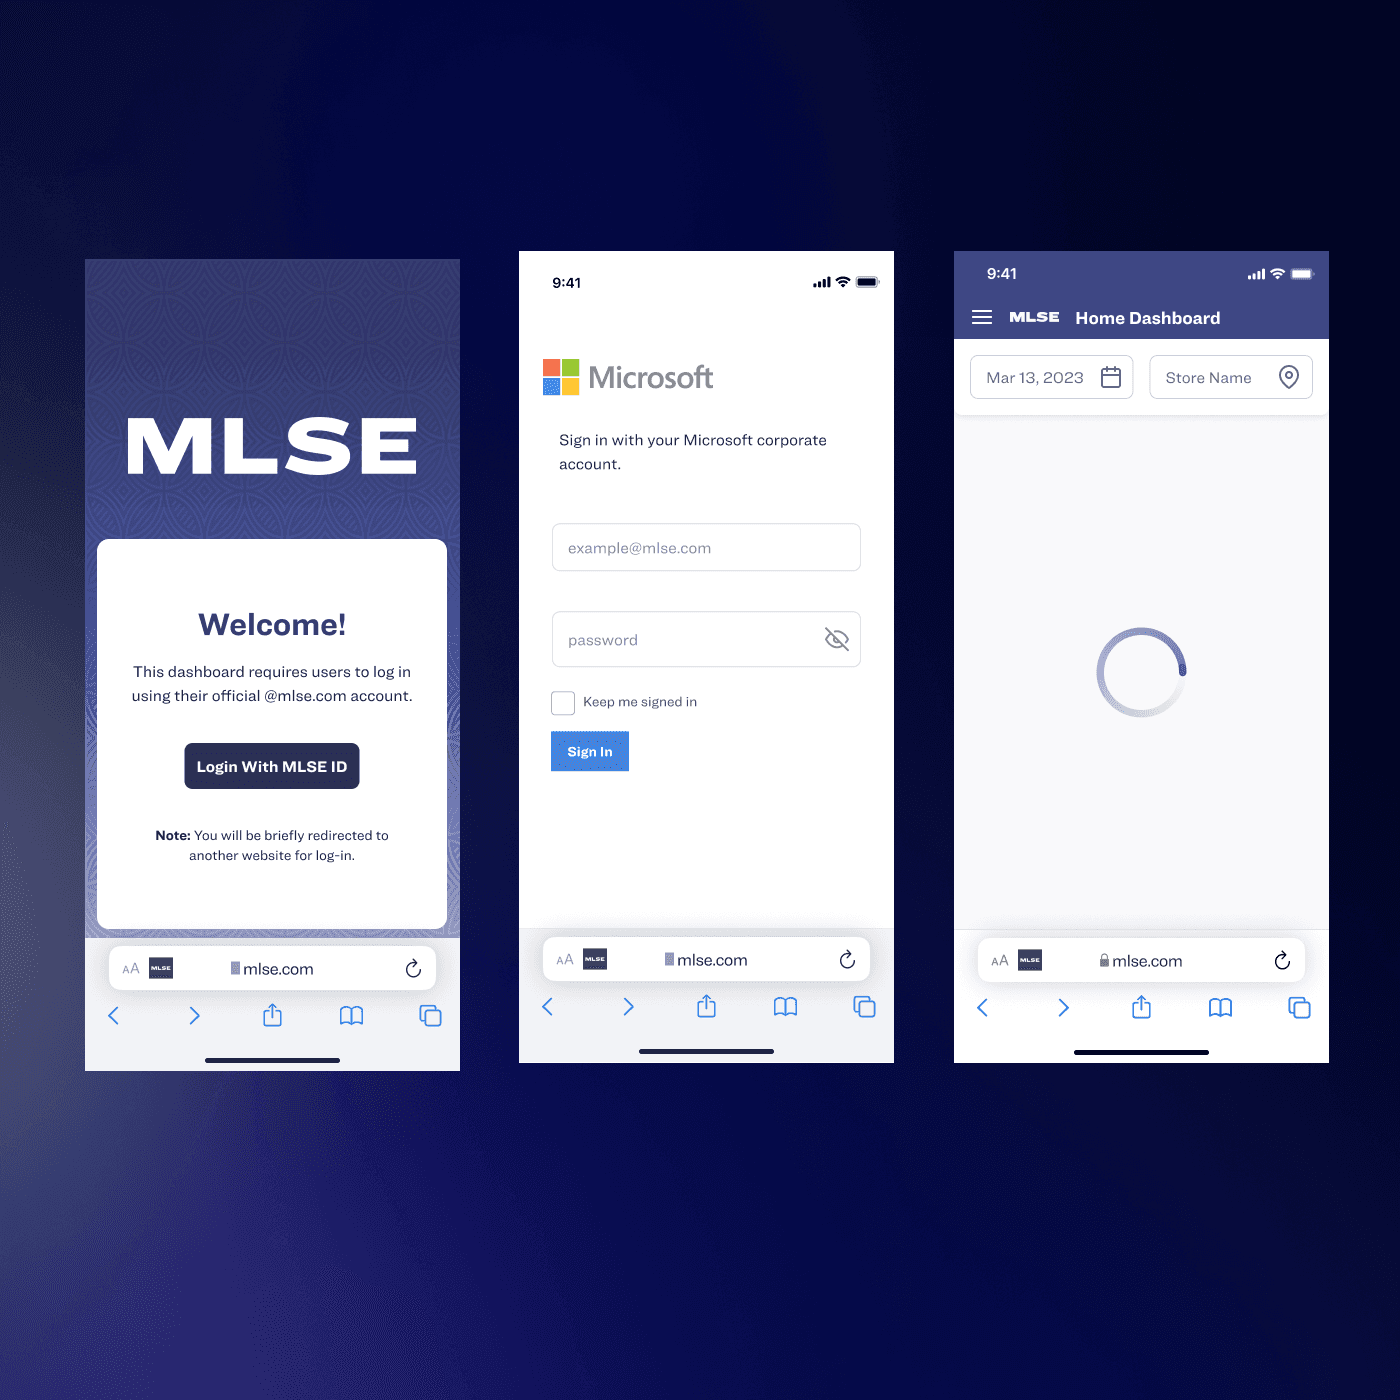


Minimal onboarding was needed
Minimal onboarding was needed
Minimal onboarding was needed
Managers were responsible for multiple venues and want to access progress for all of them.
Managers were responsible for multiple venues and want to access progress for all of them.
How did I finalize the design system?
How did I finalize the design system?
How did I finalize the design system?
The most meticulous process was ensuring the data visuals were relevant and easy to understand. I decided to have three rounds of client feedback and daily stand up withs the developers to ensure the designs were optimized.
The most meticulous process was ensuring the data visuals were relevant and easy to understand. I decided to have three rounds of client feedback and daily stand up withs the developers to ensure the designs were optimized.
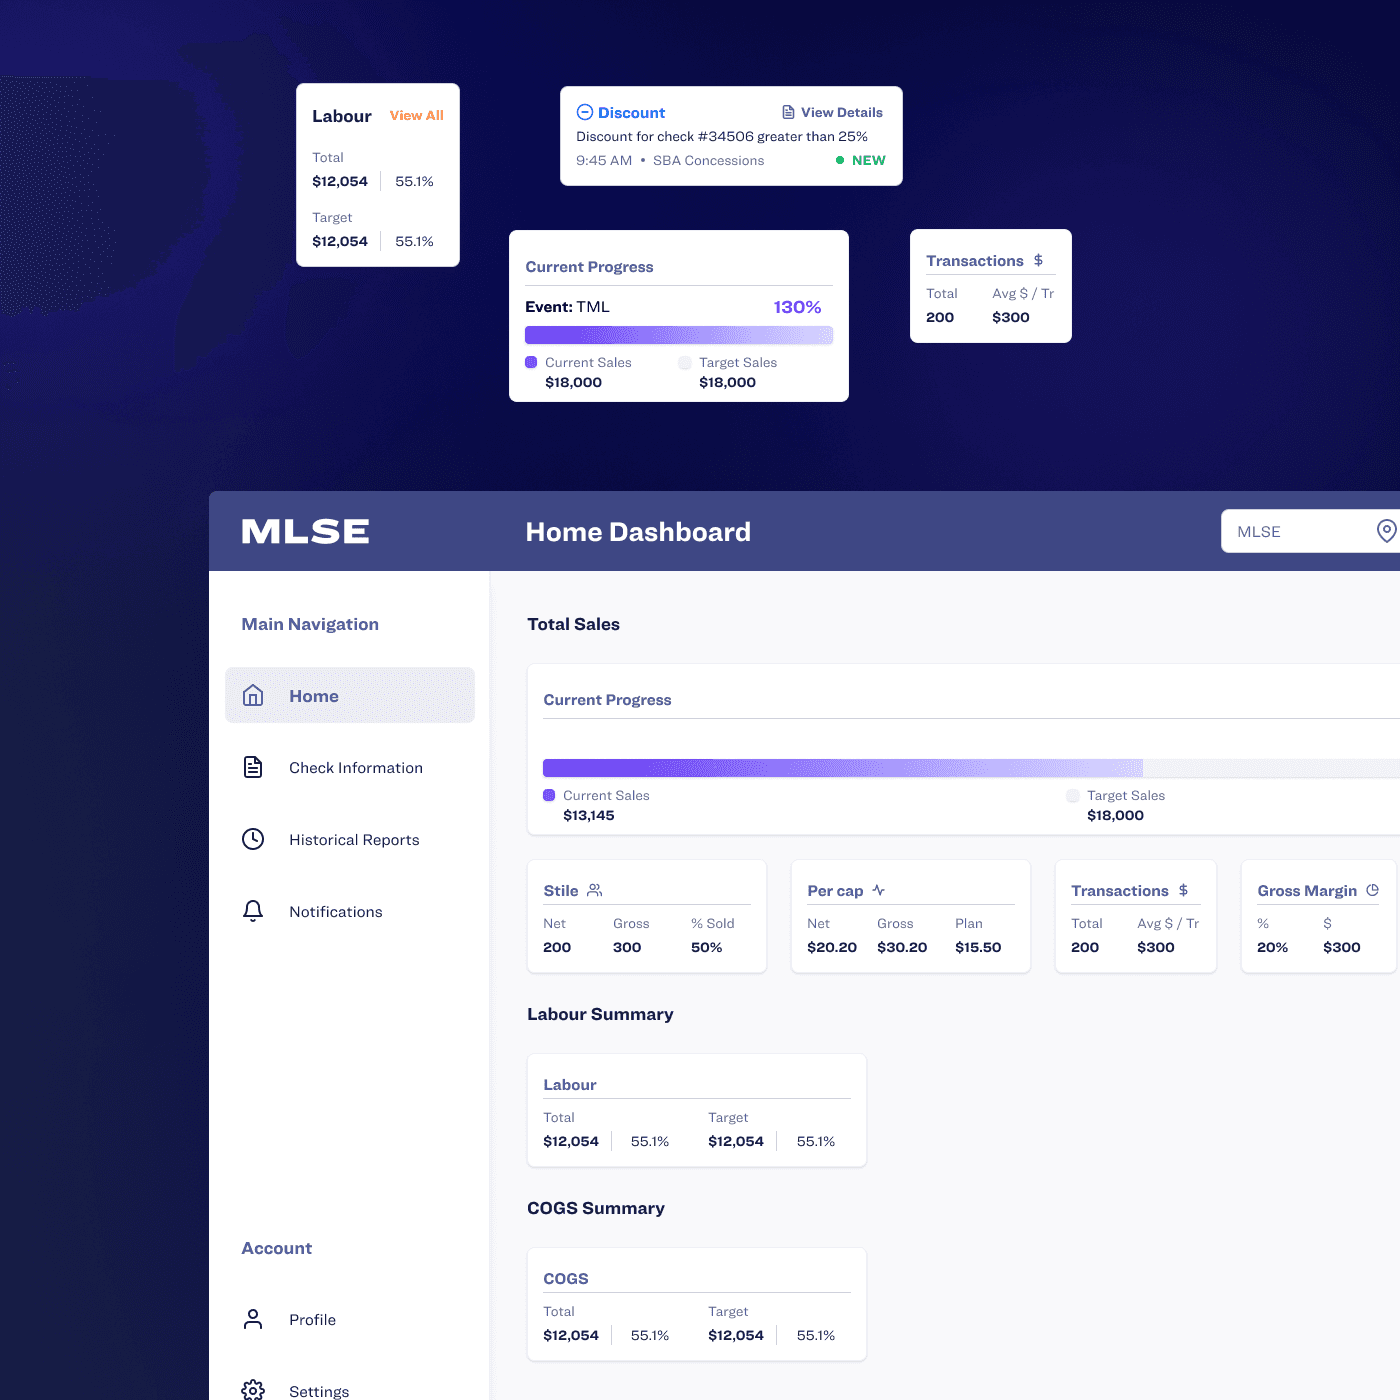


Scalable cards with data metrics
Scalable cards with data metrics
Scalable cards with data metrics
I created different cards with relevant data visuals so users can find information they needed immediately. All data visuals were simplified to simple progress bars, total summaries, line graphs, and bar graphs.
I created different cards with relevant data visuals so users can find information they needed immediately. All data visuals were simplified to simple progress bars, total summaries, line graphs, and bar graphs.
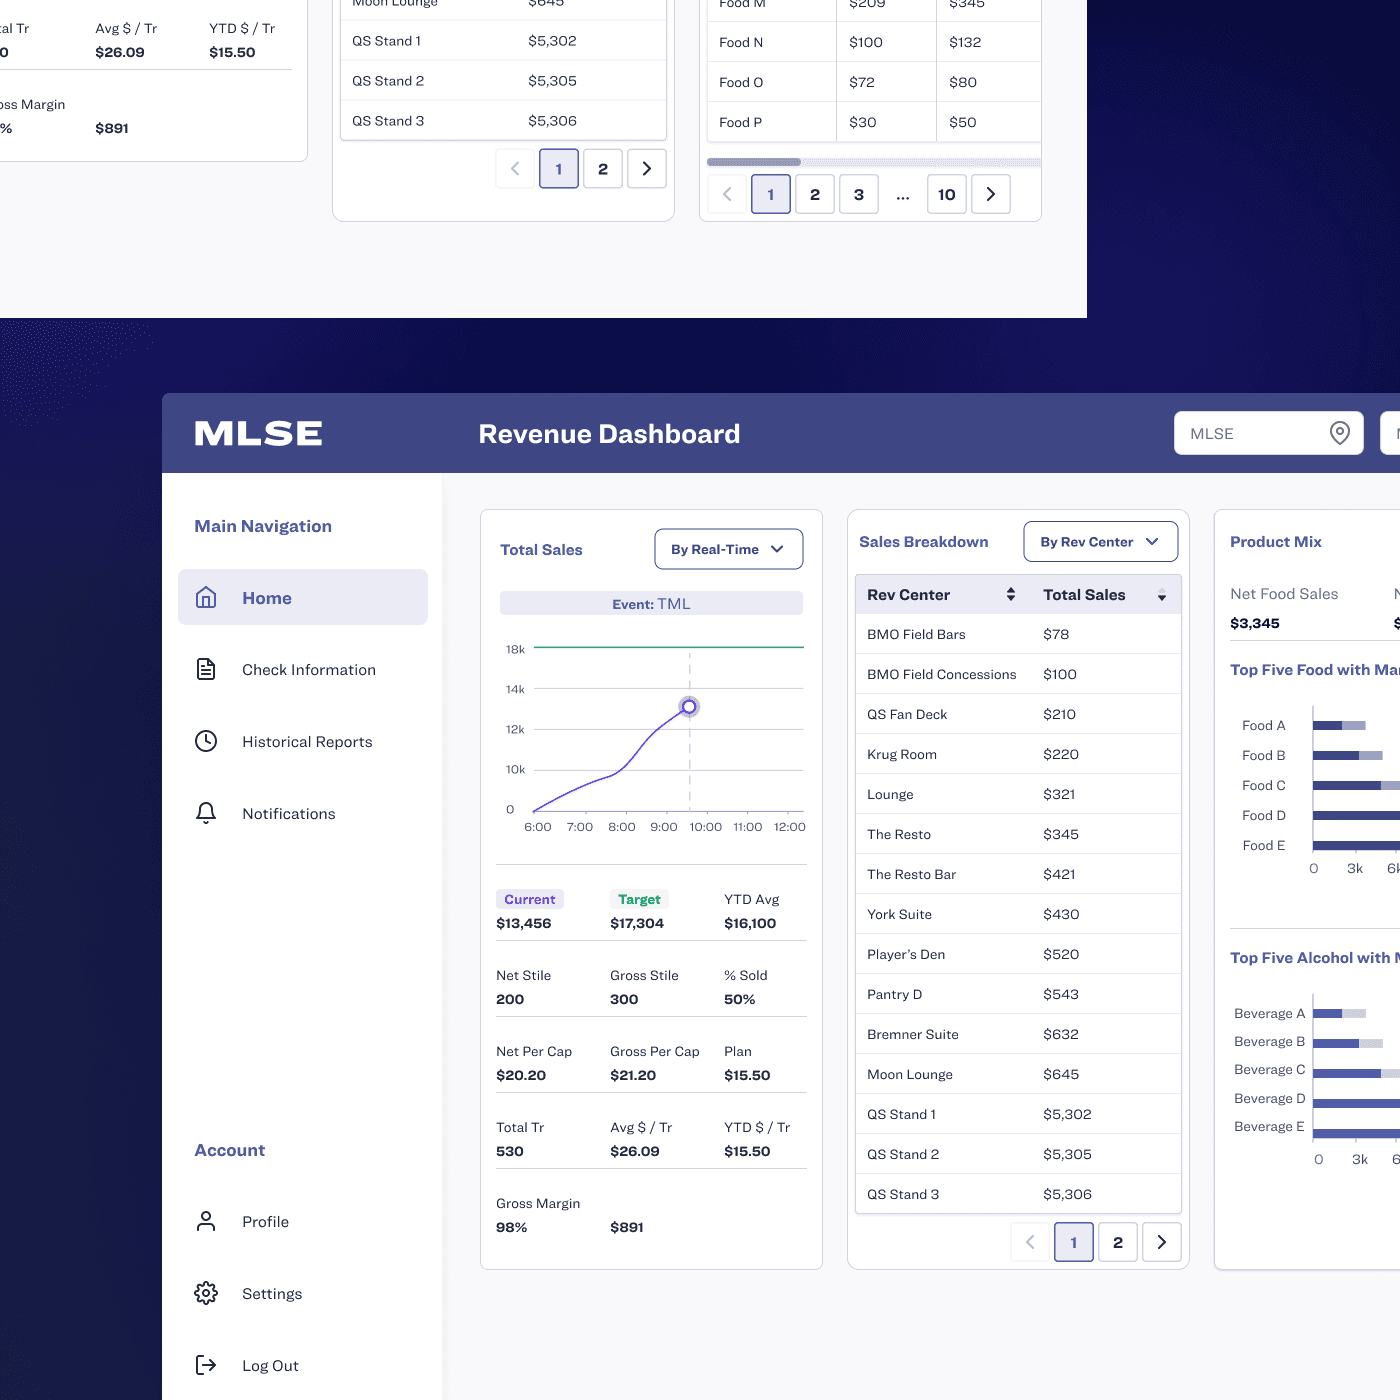


Functional colours and simple iconography
Functional colours and simple iconography
Functional colours and simple iconography
Colour legends were established so users could easily identify what colour was associated with each number. Filtering by location, amount, or page, was made simple with drop down menus and improved pagination.
Colour legends were established so users could easily identify what colour was associated with each number. Filtering by location, amount, or page, was made simple with drop down menus and improved pagination.
What was the final solution?
What was the final solution?
What was the final solution?
The most meticulous process was ensuring the data visuals were relevant and easy to understand. I decided to have three rounds of client feedback and daily stand up withs the developers to ensure the designs were optimized.
The most meticulous process was ensuring the data visuals were relevant and easy to understand. I decided to have three rounds of client feedback and daily stand up withs the developers to ensure the designs were optimized.
Location-specific dashboards with relevant summary insights
Location-specific dashboards with relevant summary insights
Users can now access dashboards that are catered to their specific venue. They can easily track process on sales, labour, and other metrics by selecting the venue location they are responsible for managing.
Users can now access dashboards that are catered to their specific venue. They can easily track process on sales, labour, and other metrics by selecting the venue location they are responsible for managing.
Consolidated reports for all historical events and their previous progress
Consolidated reports for all historical events and their previous progress
Consolidated reports for all historical events and their previous progress
Users don't need to reference paper reports and disorganized data on an unused application anymore. All event progress is now accessible by selecting the date, time, and location of previous events.
Users don't need to reference paper reports and disorganized data on an unused application anymore. All event progress is now accessible by selecting the date, time, and location of previous events.
Data tables with relevant filtering options and prioritized information
Data tables with relevant filtering options and prioritized information
Managers can easily see overall progress and optionally sort data by highest to lowest, alphabetically, or by location. Rather than scrolling through tables, the information they need can easily be prioritized to the top of their screens.
Managers can easily see overall progress and optionally sort data by highest to lowest, alphabetically, or by location. Rather than scrolling through tables, the information they need can easily be prioritized to the top of their screens.
Notifications enabled to alert any real-time concerns with sales
Notifications enabled to alert any real-time concerns with sales
Previous solutions made tracking employee activity difficult since no labour data was available. This solutions alert managers about any added tips to bills, customers receiving discounts, or employees working overtime.
Previous solutions made tracking employee activity difficult since no labour data was available. This solutions alert managers about any added tips to bills, customers receiving discounts, or employees working overtime.
What did I learn?
What did I learn?
What did I learn?
This was probably my most challenge project due to the short time frame, technical language, and the need to context switch between multiple projects. I learned that getting feedback early and frequently is important before committing to the final solution. Client feedback and taking the initiative to do daily stand ups with the developers made this project a success.
This was probably my most challenge project due to the short time frame, technical language, and the need to context switch between multiple projects. I learned that getting feedback early and frequently is important before committing to the final solution. Client feedback and taking the initiative to do daily stand ups with the developers made this project a success.
What are some next steps?
What are some next steps?
What are some next steps?
What are some ways to optimize desktop view?
What are some ways to optimize desktop view?
How can incorporate historical reports into predicting future trends?
How can incorporate historical reports into predicting future trends?
What are some ways to onboard new features?
What are some ways to onboard new features?
thanks for stopping by
© celine keomany
thanks for stopping by
© celine keomany
thanks for stopping by
© celine keomany
thanks for stopping by
© celine keomany


